Beyond background music: What brain models reveal
- Written by
- Shaad Sufi
- Published
- Reading time
- 7 min read
The room is part of the brief
Picture a hotel lobby at seven in the morning. Someone is waiting for a car, another guest is answering emails, and the front desk is welcoming an early arrival. Now picture that same room hosting an evening launch. The furniture has barely moved. The music probably should.
We work with many clients at Wubble, which gives us a practical lens on music creation: a track has a job to do in a particular setting. Commercial environments make that especially interesting. A soundtrack needs to belong to a place, a brand, and a moment—not simply fit a genre label.
That is the setting for this story. The research itself was conducted separately from our client work. We brought Wubble’s music generation together with brain-response modelling to ask a focused question: could different musical briefs produce distinguishable predicted brain-response patterns?
The wider question is older than AI. In July 1982, Ronald Milliman’s supermarket study in the Journal of Marketing examined how background-music tempo affected movement through a store and sales. Today, generation lets us vary much more than the playlist. We can change the pace, instrumentation, and density of the music itself.
More choice is useful. Understanding what to listen for—and what to test—is where our research begins.
How we studied musical environments
We structured the research around contrasting musical environments, varying tempo, arrangement density, and emotional character in Wubble’s generation prompts. The briefs ranged from restrained piano and warm pads to welcoming acoustic textures, a steady mid-tempo groove, bright pop, and dense electronic pop, with requested tempos spanning 68 to 132 beats per minute.
The music was instrumental to keep lyrics out of the comparison. We also normalised loudness before analysis to reduce differences caused simply by one recording being louder than another.
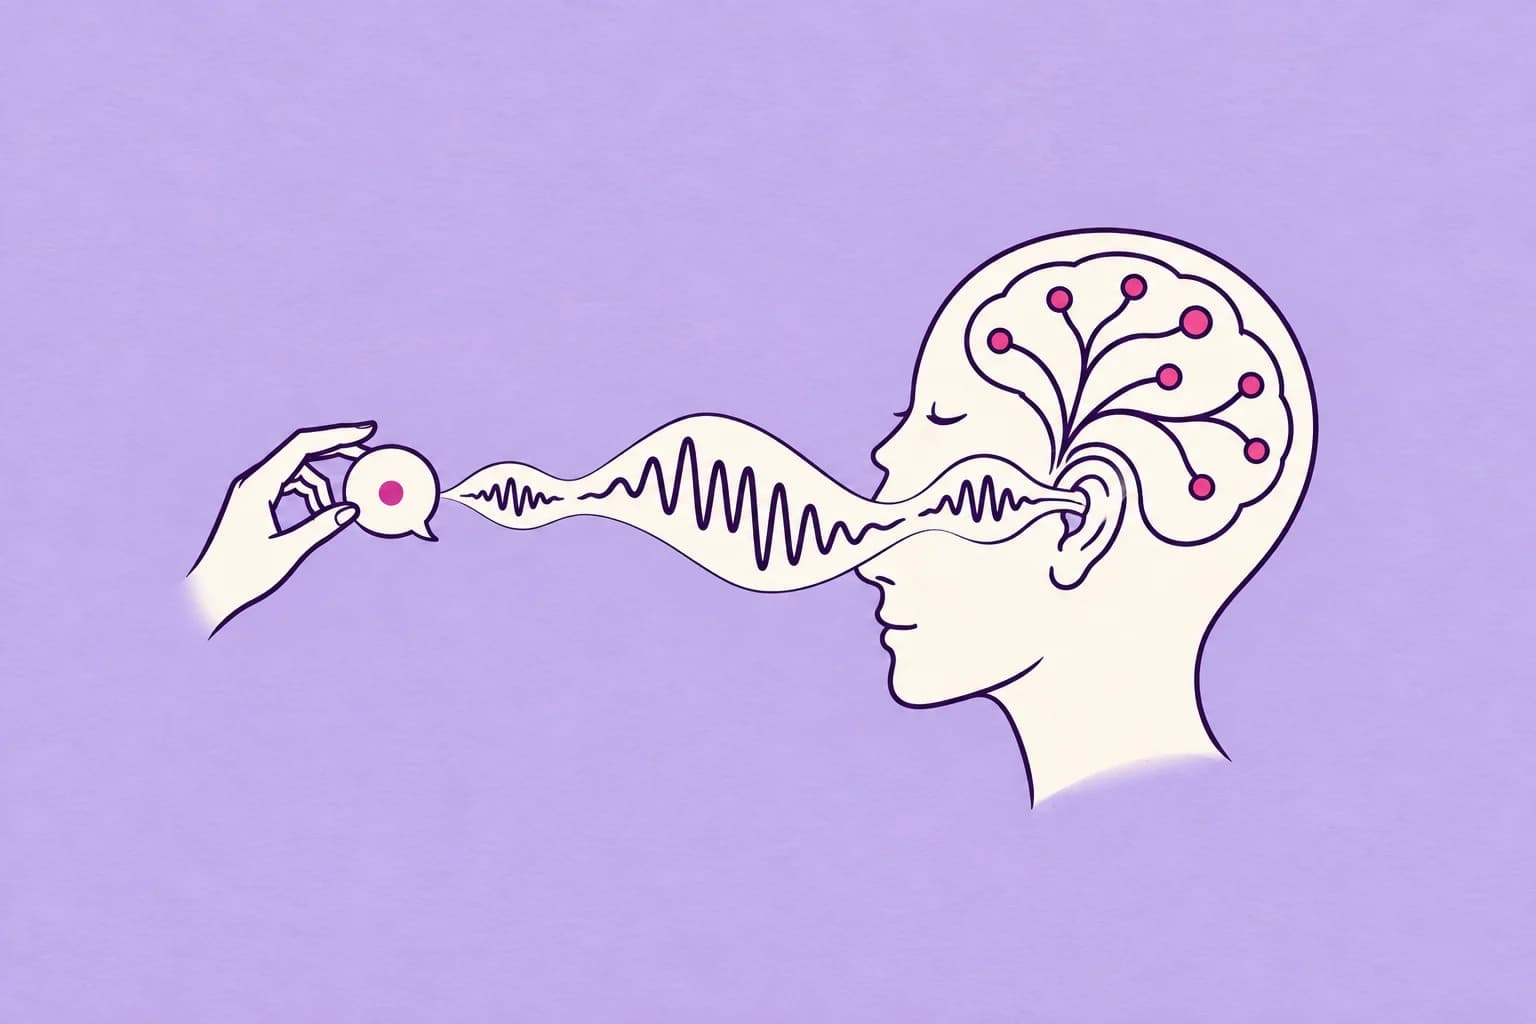
We then passed the audio into TRIBE v2, a brain encoding model that predicts cortical responses from media. For this experiment, it used audio alone and produced average-subject predictions across 20,484 points on the cortical surface—the outer layer of the brain.
This was a computer-based study. We compared model predictions rather than collecting new brain scans or watching shoppers. The analysis examined overall response levels, individual cortical regions, and the spatial patterns across the brain maps, giving us several ways to compare the musical conditions.
Seeing the music in the brain maps
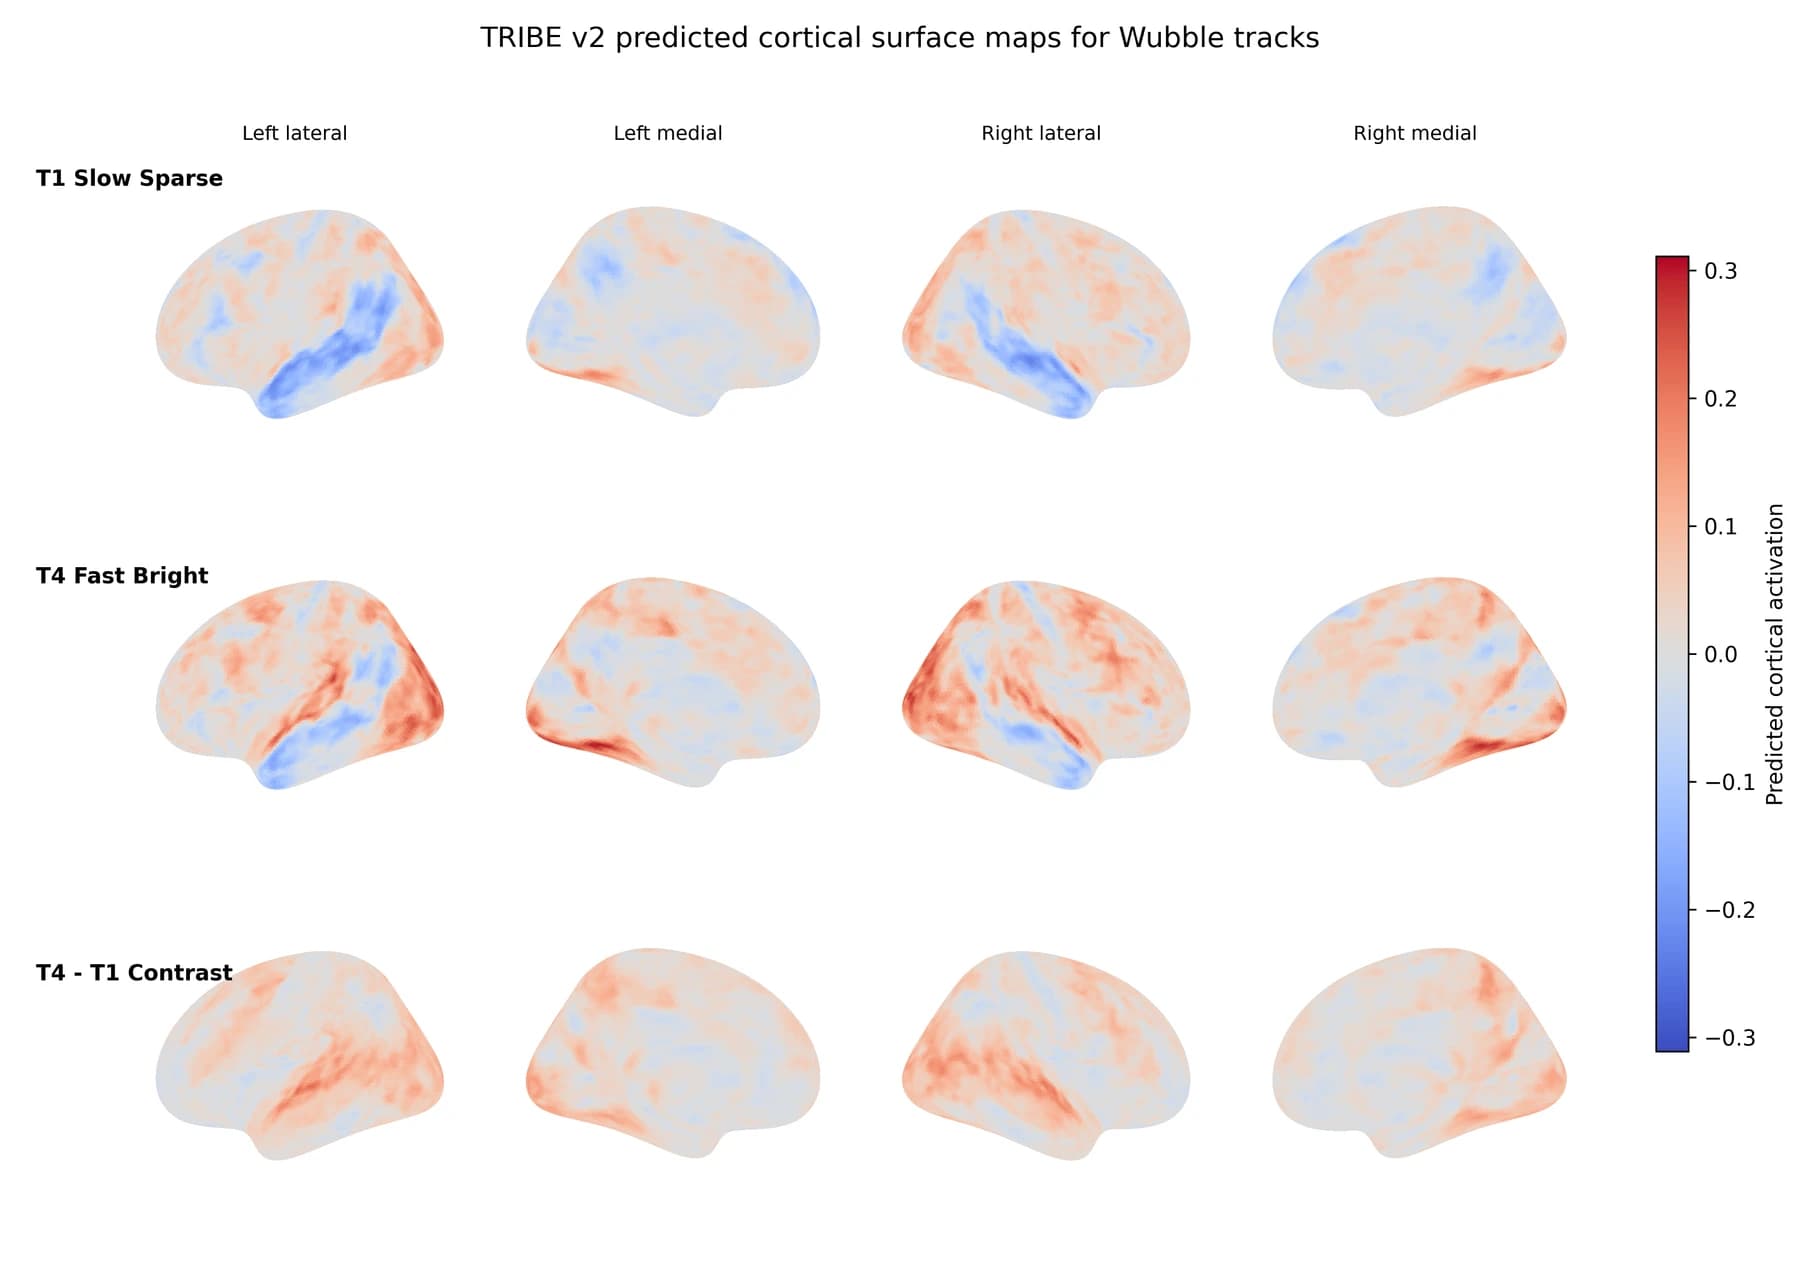
Here is what that comparison looks like. The figure below comes directly from our paper: two musical briefs, four views of the cortical surface, and a final row showing the difference between them.
Start with the top row: T1, the slow, sparse ambient track. Then look at the middle row: T4, the bright pop track. The bottom row subtracts the first pattern from the second, making their differences easier to see.
The colours show positive and negative predicted values on the scale at the right. They do not label an experience as good or bad. These are model-generated brain maps, not newly recorded scans of customers or listeners.
The bright pop track also had the highest mean response in all nine cortical regions examined in our regional analysis. Together, the maps and regional results give us evidence that the model distinguished these musical choices. The next question is how those predictions relate to what people experience in a room. Explore the full-resolution maps in Figure 3.
The fastest track didn’t lead
The most interesting result was not simply “faster music, more response.” The 124 BPM bright pop track had the highest average predicted cortical response, at 0.0402. The faster, denser 132 BPM track came next at 0.0278.
The table compares the musical conditions side by side. The tempo column records what we asked for in each prompt; the final column reports the average across the model’s predicted cortical map.
| Track and musical brief | Prompt BPM | Mean response |
|---|---|---|
| T1 · Sparse ambient | 68 | 0.0073 |
| T2 · Warm acoustic | 78 | 0.0083 |
| T3 · Balanced ambient-pop | 100 | 0.0211 |
| T4 · Bright pop | 124 | 0.0402 |
| T5 · Dense electronic-pop | 132 | 0.0278 |
Study scope: five generated tracks, one per musical brief. Source: Tables I–II of our paper. Mean responses are in arbitrary model units; BPM means beats per minute.
These values are in model response units. They are not percentages of attention, enjoyment, or sales, and a higher number does not automatically mean a better soundtrack. A hotel trying to create a restful arrival might be asking a very different question from a brand staging an energetic launch.
For a commercial brief, the useful finding is that “more energetic” is not a single dial. The fastest, densest track did not have the highest average. We changed several prompt attributes together, so this comparison cannot isolate tempo as the cause; it gives us specific musical combinations to investigate further.
What this could mean for industries
Return to the hotel lobby. The decision is not whether its soundtrack should score 0.0402. It is what kind of arrival the team wants to create, and which musical direction is worth trying. The same distinction matters across commercial environments.
Retail: matching the kind of visit
Imagine a customer taking time to compare two products, then imagine a crowd gathering for a new release. Both scenes might call for welcoming music, but the desired pace is different. A retailer could develop sparse, warm, and bright arrangements as separate candidates, then test how customers describe the atmosphere. Our model comparisons suggest a way to organise those candidates; dwell time and purchasing would still need to be measured in the store.
Hospitality: following the rhythm of a place
The morning soundtrack should leave room for conversation. An evening gathering might need more movement while still sounding like the same place. For hospitality teams, the interesting possibility is to explore related versions of a musical brief, compare their predicted patterns, and then listen with guests and staff. A coherent identity need not mean an identical atmosphere all day.
Marketing: making a brand sound intentional
A launch film, a product demonstration, and a physical activation might share a brand but ask different things of its music. Marketing teams could compare musical directions before choosing which to test with an audience. Does the music feel like the brand? Does it leave room for the message? Those questions give the model’s numbers a purpose, without turning them into a substitute for audience feedback.
These scenes illustrate possible applications. They are not client case studies or outcomes measured in this research. The practical sequence is to define the experience, generate alternatives, compare them, and test the promising directions with people.
From more music to better questions
The hotel lobby at seven in the morning and the same lobby after dark bring us back to the reason for this work. Music is heard somewhere, by someone, while something else is happening. A useful soundtrack starts with that context.
Our contribution is a way to connect those steps: Wubble-generated music, a consistent brain-response model, and comparisons across overall responses, cortical regions, and spatial patterns. Bright pop produced the highest average predicted response in our comparison, while the maps revealed differences worth examining more closely.
The next work is to repeat the comparison across more generated tracks and test how the predictions relate to listener ratings and experiences in real environments. That is how an intriguing pattern becomes useful evidence for choosing music.
It also connects to a wider question in our research. Our SNC work explores how a music file can keep its parts adjustable. This study asks how we might evaluate different musical choices. Both start from the idea that the context of listening matters.
For our work in AI music creation, producing more tracks is only the beginning. The more interesting challenge is understanding which questions to ask of them.
Read Wubble’s full research on arXiv for the experimental setup, tables, and cortical maps. This article draws on version 1, submitted on April 5, 2026.